



Responsible AIGovernance by Country
Compare national approaches to AI oversight, implementation, and institutional capacity across the Global Index.
Responsible AI Performance
Across Countries
Switch between an interactive map and a full list to explore dimension and pillar scores for every country in the 2026 GIRAI edition.
| 1 |  Norway NOR | 75.3 | 76.1 | 75.1 | 75.2 | 75.8 | 74.2 | Dive Deep |
| 2 |  Italy ITA | 72.7 | 68.4 | 73.6 | 71.7 | 79.5 | 70.4 | Dive Deep |
| 3 |  Ireland IRL | 71.4 | 70.8 | 67.8 | 76.5 | 76.6 | 65.3 | Dive Deep |
| 4 |  France FRA | 70.3 | 74.7 | 75.9 | 74.8 | 74.5 | 78.1 | Dive Deep |
| 5 |  Netherlands NLD | 69.5 | 81.6 | 80.5 | 72.3 | 83.7 | 68.1 | Dive Deep |
| 6 |  Germany DEU | 69.0 | 83.0 | 72.0 | 77.6 | 76.9 | 61.4 | Dive Deep |
| 7 |  United Kingdom of Great Britain and Northern Ireland GBR | 67.3 | 77.8 | 74.8 | 78.3 | 66.0 | 64.9 | Dive Deep |
| 8 |  Slovenia SVN | 66.1 | 67.8 | 65.6 | 67.9 | 73.5 | 55.9 | Dive Deep |
| 9 |  Latvia LVA | 65.2 | 72.6 | 56.9 | 73.1 | 74.3 | 49.0 | Dive Deep |
| 10 |  Estonia EST | 64.9 | 76.5 | 56.5 | 58.7 | 72.3 | 60.4 | Dive Deep |
Compare responsible AI performance
Explore how countries and regions perform across GIRAI's governance dimensions, scores, and structural indicators.
Dimension scores
Indicators
37 of 37| Indicator | Norway | Italy | Europe |
|---|---|---|---|
| Inclusion and Diversity7 | |||
APGender Equality | 72.5 | 62.7 | 51.1 |
APChildren's Rights | 80.3 | 73.9 | 59.0 |
APCultural and Linguistic Diversity | 66.7 | 72.3 | 41.8 |
CSOCivil Society Engagement in Inclusion and Diversity | 38.5 | 15.4 | 21.4 |
ECEgalitarian Democracy | 100.0 | 76.8 | 67.6 |
ECDevice Affordability | 89.6 | 73.6 | 76.1 |
ECGender Gap in Mobile Internet | 93.9 | 100.0 | 95.3 |
| Ethics and Sustainability7 | |||
APFairness and Non-discrimination | 73.9 | 83.0 | 60.1 |
APTransparency and Explainability | 73.9 | 83.0 | 64.5 |
APHuman Oversight and Determination | 73.9 | 74.5 | 57.8 |
APEnvironmental Impact | 70.1 | 80.7 | 28.5 |
CSOCivil Society Engagement in Ethics and Sustainability | 15.4 | 76.9 | 30.8 |
ECLow-Carbon Energy Share | 98.6 | 50.2 | 64.7 |
ECRule of Law | 100.0 | 68.0 | 69.2 |
| Labour and Skills6 | |||
APLabour Protections | 73.2 | 73.2 | 53.9 |
APReskilling/Upskilling Initiatives | 66.7 | 73.1 | 56.0 |
APAI Literacy | 66.0 | 73.2 | 52.3 |
CSOCivil Society Engagement in Labour and Skills | 51.3 | 65.6 | 30.1 |
ECLabour Rights & Compliance | 100.0 | 47.6 | 62.9 |
ECSkills & Literacy | 92.3 | 94.1 | 87.4 |
| Trust and Safety10 | |||
APSafety and Security | 74.5 | 83.6 | 60.7 |
APAccess to Redress and Remedy | 73.9 | 73.9 | 55.0 |
APImpact Assessments | 73.2 | 73.2 | 60.4 |
APAI-facilitated Misinformation and Violence | 79.5 | 88.6 | 58.4 |
CSOCivil Society Engagement in Trust and Safety | 39.6 | 30.8 | 24.0 |
ECData Protection and Privacy | 66.8 | 100.0 | 84.2 |
ECData Sharing and Access | 100.0 | 93.8 | 87.1 |
ECConsumer Protection | 97.7 | 100.0 | 91.6 |
ECCybersecurity | 96.9 | 100.0 | 88.6 |
ECGlobal Peace | 82.3 | 81.5 | 79.4 |
| AI Use in Public Service7 | |||
APPublic Sector Skills Development | 69.3 | 72.9 | 42.0 |
APPublic Disclosure of Government Algorithmic Systems | 63.8 | 62.9 | 21.5 |
APPublic Procurement | 64.8 | 63.9 | 25.3 |
CSOGovernment Mechanisms for CSO Inclusion in AI Policy and Governance | 70.0 | 70.0 | 43.8 |
ECCivil Society Accountability | 96.3 | 80.0 | 75.5 |
ECPublic Service Delivery | 79.8 | 90.1 | 86.3 |
ECAccess to Public Information | 100.0 | 64.6 | 62.9 |
| Score adjustment | |||
URAIUnacceptable Risk AI Systems | No penalty | No penalty | ×0.98Regional average |
Top 10 take away
Strengthening Clarity, Comparability, and Implementation Focus
AI adoption is expanding rapidly around the world, but governance is struggling to keep pace. While more than half of the global population has used generative AI tools, average GIRAI scores remain low, highlighting significant gaps between AI deployment and responsible governance.
- The weakest-performing dimension of the Index is AI Use in Public Service — countries have frameworks addressing its indicators in just 31% of cases, against a 42% global average across all dimensions.
- The two worst-performing indicators of the entire Index sit in this dimension: only 26% of countries have frameworks for fair, accountable Public Procurement of AI, and only 18% require Public Disclosure of Government Algorithmic Systems.
- This reveals an asymmetry: AI is increasingly treated as something the state must regulate in the market, but not as something the state must account for in its own exercise of power — even though public-sector AI directly affects rights, entitlements, and access to welfare, healthcare, and education.
- Procurement leaders include Brazil, Chile (Public Procurement Directive No. 44), and Australia (National Framework for the Assurance of AI in Government, with a dedicated procurement section guarding against vendor lock-in).
- Overall, responsible AI governance is expanding, but the institutions, systems, and infrastructure needed to govern AI in the public interest remain underdeveloped and outpaced by AI's rapid diffusion.
| Dimension | Has framework | No framework |
|---|---|---|
| AI Use in Public Service | 30.86% | 69.14% |
| Ethics and Sustainability | 47.59% | 52.41% |
| Inclusion and Diversity | 38.77% | 61.23% |
| Labour and Skills | 44.94% | 55.06% |
| Trust and Safety | 44.81% | 55.19% |
| Total | 41.96% | 58.04% |
Bright Spot · Brazil
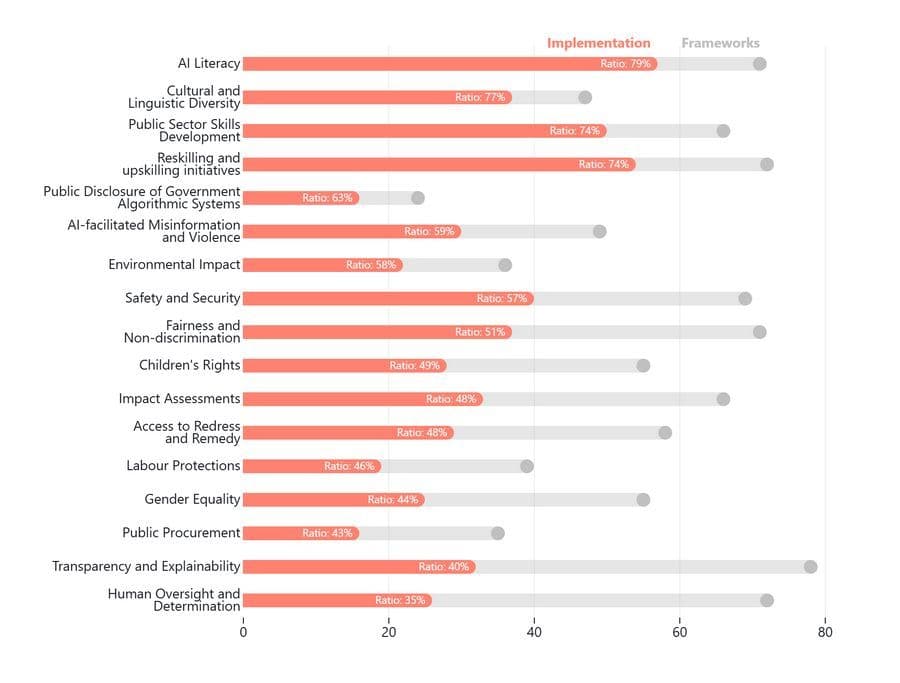
Brazil is one of only 15 of 135 countries with both a policy and a government-led initiative on AI public procurement (the Brazilian AI Strategy plus InovaCPIN, a multi-agency procurement platform). It is also among the 7 Global South countries with environmental-impact frameworks plus implementation, 1 of only 12 of 98 showing labour-protection activity, and 1 of just 13 with frameworks mandating disclosure of government AI systems (its Generative AI Handbook for Public Service).
Global Index on Responsible AI — 2026 Report
Download the latest edition of the Global Index on Responsible AI, offering comparative insights into how countries govern and use artificial intelligence.